ملف:LogisticMap BifurcationDiagram.png
اذهب إلى التنقل
اذهب إلى البحث
حجم هذه المعاينة: ٨٠٠ × ٥٦٦ بكسل. الأبعاد الأخرى: ٣٢٠ × ٢٢٦ بكسل | ٦٤٠ × ٤٥٣ بكسل | ١٬٠٢٤ × ٧٢٤ بكسل | ١٬٢٨٠ × ٩٠٥ بكسل | ١٬٨٣٨ × ١٬٣٠٠ بكسل.
الملف الأصلي (١٬٨٣٨ × ١٬٣٠٠ بكسل حجم الملف: ٥٧١ كيلوبايت، نوع MIME: image/png)
ملخص
| الوصف |
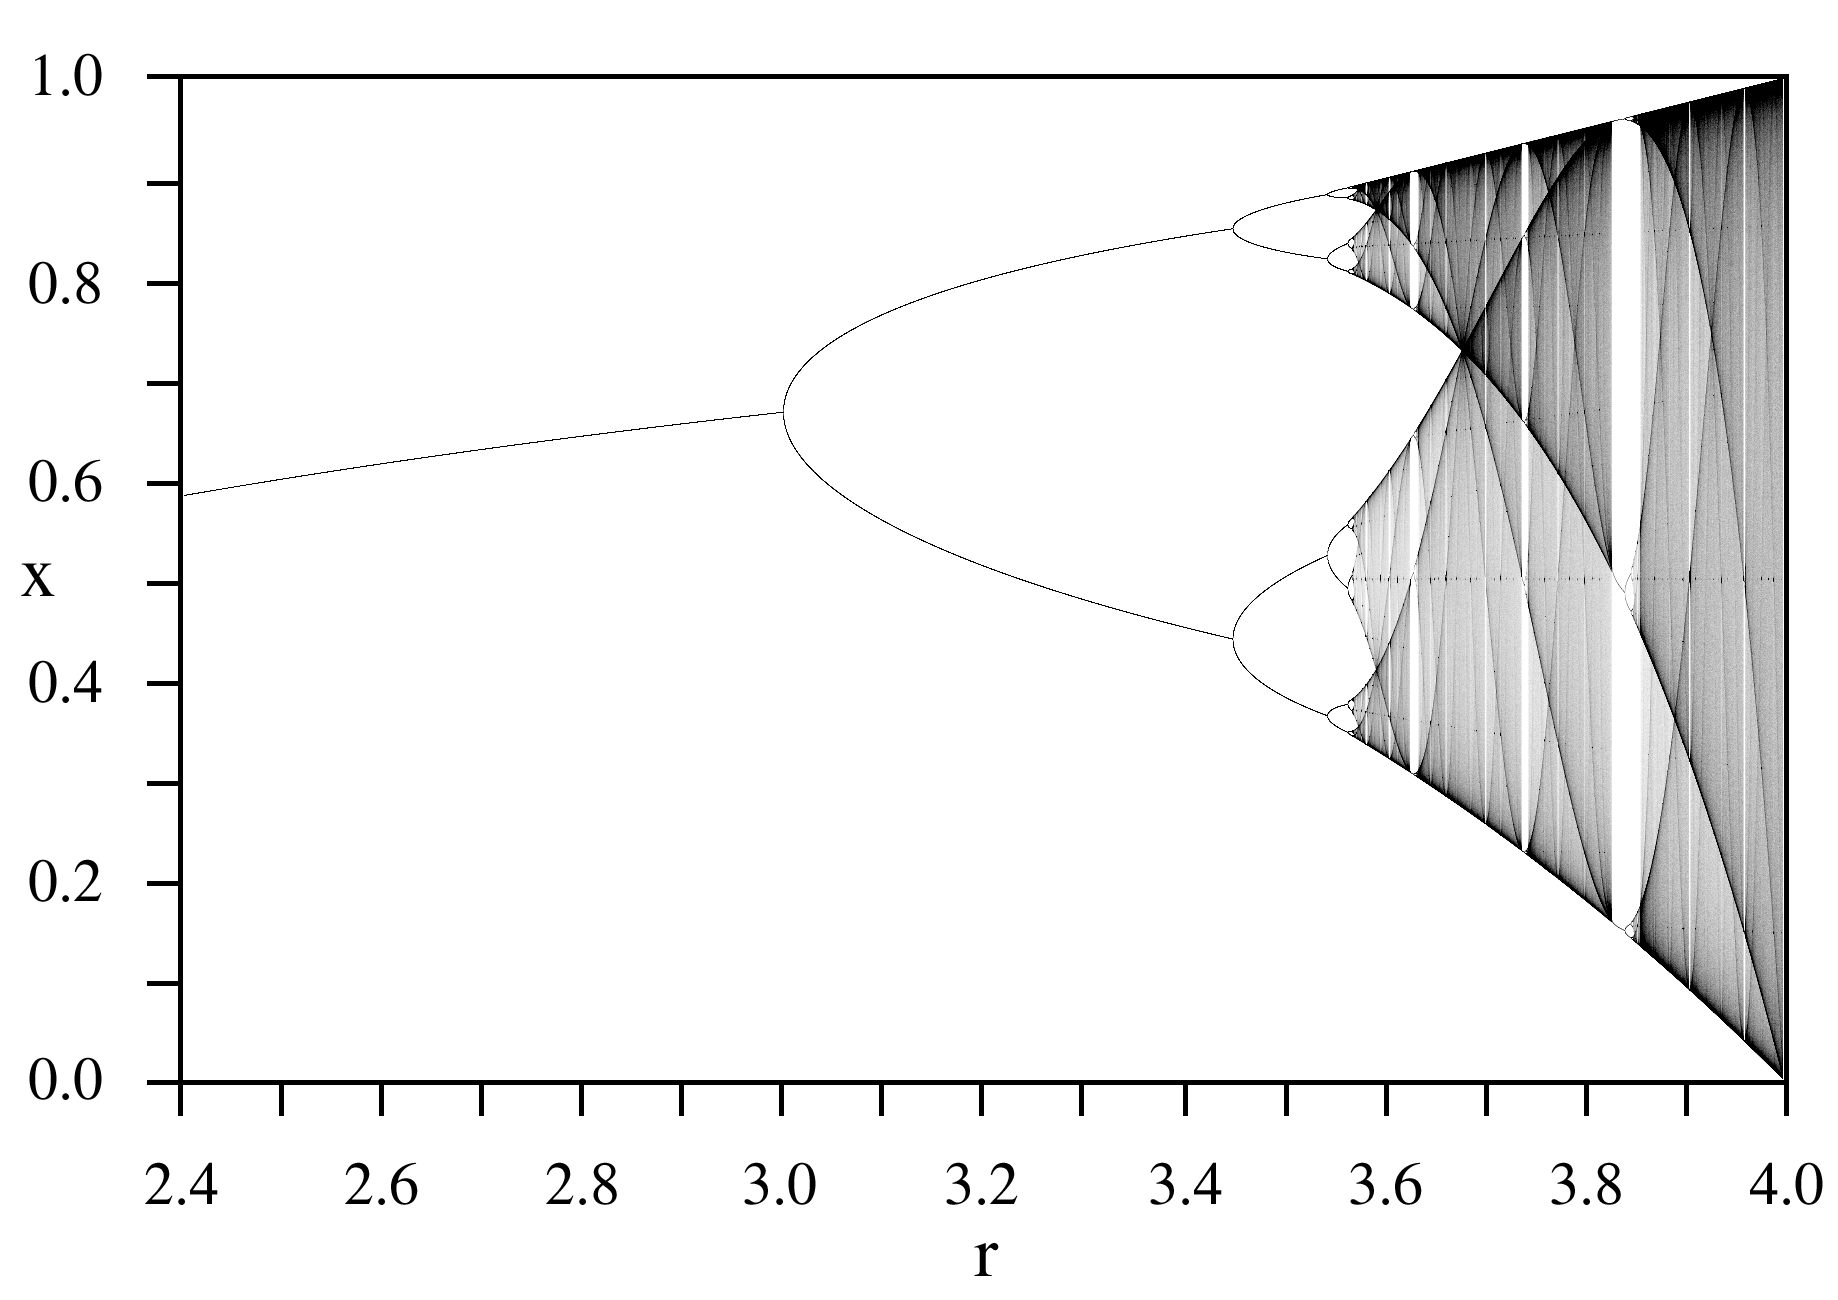
English: A bifurcation diagram for the Logistic map:
|
| التاريخ | |
| المصدر | عمل شخصي |
| المؤلف | PAR |

ترخيص
| أنا، مالِك حقوق تأليف ونشر هذا العمل، أجعله في النِّطاق العامِّ، يسري هذا في أرجاء العالم كلِّه. في بعض البلدان، قد يكون هذا التَّرخيص غيرَ مُمكنٍ قانونيَّاً، في هذه الحالة: أمنح الجميع حق استخدام هذا العمل لأي غرض دون أي شرط ما لم يفرض القانون شروطًا إضافية. |

|
هذه الصورة / الصورتان باستعمال رسومات متجهية ملفات رسوميات شعاعية.
It is recommended to name the SVG file "LogisticMap BifurcationDiagram.svg" - then the template Vector version available (or Vva) does not need the new image name parameter.
|
تاريخ الملف
اضغط على زمن/تاريخ لرؤية الملف كما بدا في هذا الزمن.
| زمن/تاريخ | صورة مصغرة | الأبعاد | مستخدم | تعليق | |
|---|---|---|---|---|---|
| حالي | ٠١:١١، ١٤ سبتمبر ٢٠٠٥ | | ١٬٨٣٨ × ١٬٣٠٠ (٥٧١ كيلوبايت) | wikimediacommons>PAR~commonswiki | Bifurcation diagram for the logistic map for parameter r=2.4 to 4.0. |
استخدام الملف
الصفحة التالية تستخدم هذا الملف: