ملف:Prime number theorem ratio convergence.svg
اذهب إلى التنقل
اذهب إلى البحث

حجم معاينة PNG لذلك الملف ذي الامتداد SVG: ٢٥٠ × ١٦٠ بكسل. الأبعاد الأخرى: ٣٢٠ × ٢٠٥ بكسل | ٦٤٠ × ٤١٠ بكسل | ١٬٠٢٤ × ٦٥٥ بكسل | ١٬٢٨٠ × ٨١٩ بكسل | ٢٬٥٦٠ × ١٬٦٣٨ بكسل.
الملف الأصلي (ملف SVG، أبعاده ٢٥٠ × ١٦٠ بكسل، حجم الملف: ٨٧ كيلوبايت)
ملخص
| الوصف |
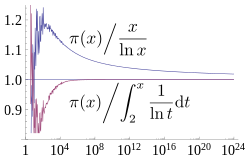
English: A plot showing how two estimates described by the prime number theorem, and converge asymptotically towards , the number of primes less than x. The x axis is and is logarithmic (labelled in evenly spaced powers of 10), going up to 1024, the largest for which is currently known. The former estimate converges extremely slowly, while the latter has visually converged on this plot by 108. Source used to generate this chart is shown below. |
| التاريخ | |
| المصدر | عمل شخصي |
| المؤلف | Dcoetzee |
| SVG منشأ الملف |


ترخيص
أنا، صاحب حقوق التأليف والنشر لهذا العمل، أنشر هذا العمل تحت الرخصة التالية:
| هذا الملف متوفر تحت ترخيص المشاع الإبداعي CC0 1.0 الحقوق العامة. | |
| لقد وَضَعَ صاحب حقوق التَّأليف والنَّشر هذا العملَ في النَّطاق العامّ من خلال تنازُلِه عن حقوق العمل كُلِّها في أنحاء العالم جميعها تحت قانون حقوق التَّأليف والنَّشر، ويشمل ذلك الحقوق المُتَّصِلة بها والمُجاورة لها برمتها بما يتوافق مع ما يُحدده القانون. يمكنك نسخ وتعديل وتوزيع وإعادة إِنتاج العمل، بما في ذلك لأغراضٍ تجاريَّةٍ، دون حاجةٍ لطلب مُوافَقة صاحب حقوق العمل.
|
Source
All source released under CC0 waiver.
Mathematica source to generate graph (which was then saved as SVG from Mathematica):
(* Sample both functions at 600 logarithmically spaced points between \
1 and 2^40 *)
base = N[E^(24 Log[10]/600)];
ratios = Table[{Round[base^x],
    N[PrimePi[Round[base^x]]/(base^x/(x*Log[base]))]}, {x, 1,
    Floor[40/Log[2, base]]}];
ratiosli =
  Table[{Round[base^x],
    N[PrimePi[
       Round[base^x]]/(LogIntegral[base^x] - LogIntegral[2])]}, {x,
    Ceiling[Log[base, 2]], Floor[40/Log[2, base]]}];
(* Supplement with larger known PrimePi values that are too large for \
Mathematica to compute *)
LargePiPrime = {{10^13, 346065536839}, {10^14, 3204941750802}, {10^15,
     29844570422669}, {10^16, 279238341033925}, {10^17,
    2623557157654233}, {10^18, 24739954287740860}, {10^19,
    234057667276344607}, {10^20, 2220819602560918840}, {10^21,
    21127269486018731928}, {10^22, 201467286689315906290}, {10^23,
    1925320391606803968923}, {10^24, 18435599767349200867866}};
ratios2 =
  Join[ratios,
   Map[{#[[1]], N[#[[2]]]/(#[[1]]/(Log[#[[1]]]))} &, LargePiPrime]];
ratiosli2 =
  Join[ratiosli,
   Map[{#[[1]], N[#[[2]]]/(LogIntegral[#[[1]]] - LogIntegral[2])} &,
    LargePiPrime]];
(* Plot with log x axis, together with the horizontal line y=1 *)
Show[LogLinearPlot[1, {x, 1, 10^24}, PlotRange -> {0.8, 1.25}],
 ListLogLinearPlot[{ratios2, ratiosli2}, Joined -> True],
 LabelStyle -> FontSize -> 14]
LaTeX source for labels:
$$ \left.{\pi(x)}\middle/{\frac{x}{\ln x}}\right. $$
$$ \left.{\pi(x)}\middle/{\int_2^x \frac{1}{\ln t} \mathrm{d}t}\right. $$
These were converted to SVG with [1] and then the graph was embedded into the resulting document in Inkscape. Axis fonts were also converted to Liberation Serif in Inkscape.
تاريخ الملف
اضغط على زمن/تاريخ لرؤية الملف كما بدا في هذا الزمن.
| زمن/تاريخ | صورة مصغرة | الأبعاد | مستخدم | تعليق | |
|---|---|---|---|---|---|
| حالي | ١٤:٠٧، ٢١ مارس ٢٠١٣ | | ٢٥٠ × ١٦٠ (٨٧ كيلوبايت) | wikimediacommons>Dcoetzee | Change n to x to match article |
استخدام الملف
الصفحتان التاليتان تستخدمان هذا الملف: