ملف:MultivariateNormal.png
اذهب إلى التنقل
اذهب إلى البحث
حجم هذه المعاينة: ٧٩٣ × ٦٠٠ بكسل. الأبعاد الأخرى: ٣١٧ × ٢٤٠ بكسل | ٦٣٥ × ٤٨٠ بكسل | ٨٤٢ × ٦٣٧ بكسل.
الملف الأصلي (٨٤٢ × ٦٣٧ بكسل حجم الملف: ١٥٩ كيلوبايت، نوع MIME: image/png)
ملخص
| الوصف |
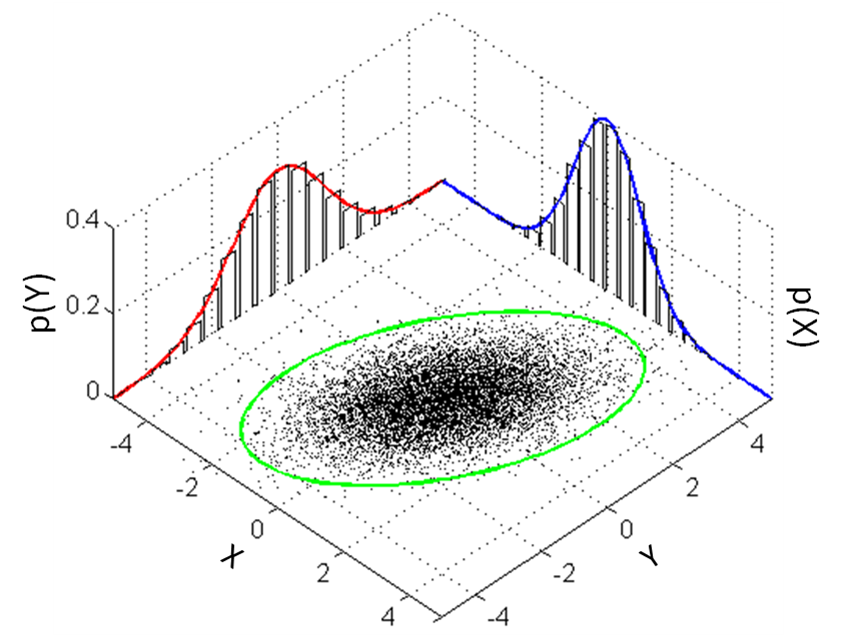
English: Illustration of a multivariate gaussian distribution and its marginals. Matlab code provided below. |
|||
| التاريخ | ||||
| المصدر | عمل شخصي | |||
| المؤلف | Bscan | |||
| إصدارات أخرى |
|
|||
| PNG منشأ الملف |


Source code
%This script illustrates a multivariate Gaussian distribution and its
%marginal distributions

%This code is issued under the CC0 "license"

%Define limits of plotting
X = -5:0.1:5;
Y = -5:0.1:5;

%2-d Mean and covariance matrix
MeanVec = [0 0];
CovMatrix = [1 0.6; 0.6 2];

%Get the 1-d PDFs for the "walls"
Z_x = normpdf(X,MeanVec(1), sqrt(CovMatrix(1,1)));
Z_y = normpdf(Y,MeanVec(2), sqrt(CovMatrix(2,2)));

%Get the 2-d samples for the "floor"
Samples = mvnrnd(MeanVec, CovMatrix, 10000);

%Get the sigma ellipses by transform a circle by the cholesky decomp
L = chol(CovMatrix,'lower');
t = linspace(0,2*pi,100); %Our ellipse will have 100 points on it
C = [cos(t) ; sin(t)]; %A unit circle
E1 = 1*L*C; E2 = 2*L*C; E3 = 3*L*C; %Get the 1,2, and 3-sigma ellipses

figure; hold on;
%Plot the samples on the "floor"
plot3(Samples(:,1),Samples(:,2),zeros(size(Samples,1),1),'k.','MarkerSize',2)
%Plot the 1,2, and 3-sigma ellipses slightly above the floor
%plot3(E1(1,:), E1(2,:), 1e-3+zeros(1,size(E1,2)),'Color','g','LineWidth',2);
%plot3(E2(1,:), E2(2,:), 1e-3+zeros(1,size(E2,2)),'Color','g','LineWidth',2);
plot3(E3(1,:), E3(2,:), 1e-3+zeros(1,size(E3,2)),'Color','g','LineWidth',2);

%Plot the histograms on the walls from the data in the middle
[n_x, xout] = hist(Samples(:,1),20);%Creates 20 bars
n_x = n_x ./ ( sum(n_x) *(xout(2)-xout(1)));%Normalizes to be a pdf
[~,~,~,x_Pos,x_Height] = makebars(xout,n_x);%Creates the bar points
plot3(x_Pos, Y(end)*ones(size(x_Pos)),x_Height,'-k')

%Now plot the other histograms on the wall
[n_y, yout] = hist(Samples(:,2),20);
n_y = n_y ./ ( sum(n_y) *(yout(2)-yout(1)));
[~,~,~,y_Pos,y_Height] = makebars(yout,n_y);
plot3(X(1)*ones(size(y_Pos)),y_Pos, y_Height,'-k')

%Now plot the 1-d pdfs over the histograms
plot3(X, ones(size(X))*Y(end), Z_x,'-b','LineWidth',2);
plot3(ones(size(Y))*X(1), Y, Z_y,'-r','LineWidth',2);

%Make the figure look nice
grid on; view(45,55);
axis([X(1) X(end) Y(1) Y(end)])
ترخيص
Bscan، صاحب حقوق التأليف والنشر لهذا العمل، أنشر هذا العمل تحت الرخصة التالية:
| هذا الملف متوفر تحت ترخيص المشاع الإبداعي CC0 1.0 الحقوق العامة. | |
| لقد وَضَعَ صاحب حقوق التَّأليف والنَّشر هذا العملَ في النَّطاق العامّ من خلال تنازُلِه عن حقوق العمل كُلِّها في أنحاء العالم جميعها تحت قانون حقوق التَّأليف والنَّشر، ويشمل ذلك الحقوق المُتَّصِلة بها والمُجاورة لها برمتها بما يتوافق مع ما يُحدده القانون. يمكنك نسخ وتعديل وتوزيع وإعادة إِنتاج العمل، بما في ذلك لأغراضٍ تجاريَّةٍ، دون حاجةٍ لطلب مُوافَقة صاحب حقوق العمل.
|
تاريخ الملف
اضغط على زمن/تاريخ لرؤية الملف كما بدا في هذا الزمن.
| زمن/تاريخ | صورة مصغرة | الأبعاد | مستخدم | تعليق | |
|---|---|---|---|---|---|
| حالي | ٢٠:٣٠، ٢٢ مارس ٢٠١٣ | | ٨٤٢ × ٦٣٧ (١٥٩ كيلوبايت) | wikimediacommons>Bscan | User created page with UploadWizard |
استخدام الملف
الصفحة التالية تستخدم هذا الملف: