ملف:HighSensitivity LowSpecificity 1401x1050.png
اذهب إلى التنقل
اذهب إلى البحث
حجم هذه المعاينة: ٨٠٠ × ٦٠٠ بكسل. الأبعاد الأخرى: ٣٢٠ × ٢٤٠ بكسل | ٦٤٠ × ٤٨٠ بكسل | ١٬٠٢٤ × ٧٦٧ بكسل | ١٬٢٨٠ × ٩٥٩ بكسل | ١٬٤٠١ × ١٬٠٥٠ بكسل.
الملف الأصلي (١٬٤٠١ × ١٬٠٥٠ بكسل حجم الملف: ٩٣ كيلوبايت، نوع MIME: image/png)

|
هذه diagram الصورة / الصورتان باستعمال رسومات متجهية ملفات رسوميات شعاعية.
It is recommended to name the SVG file "HighSensitivity LowSpecificity 1401x1050.svg" - then the template Vector version available (or Vva) does not need the new image name parameter.
|
ملخص
| الوصف |
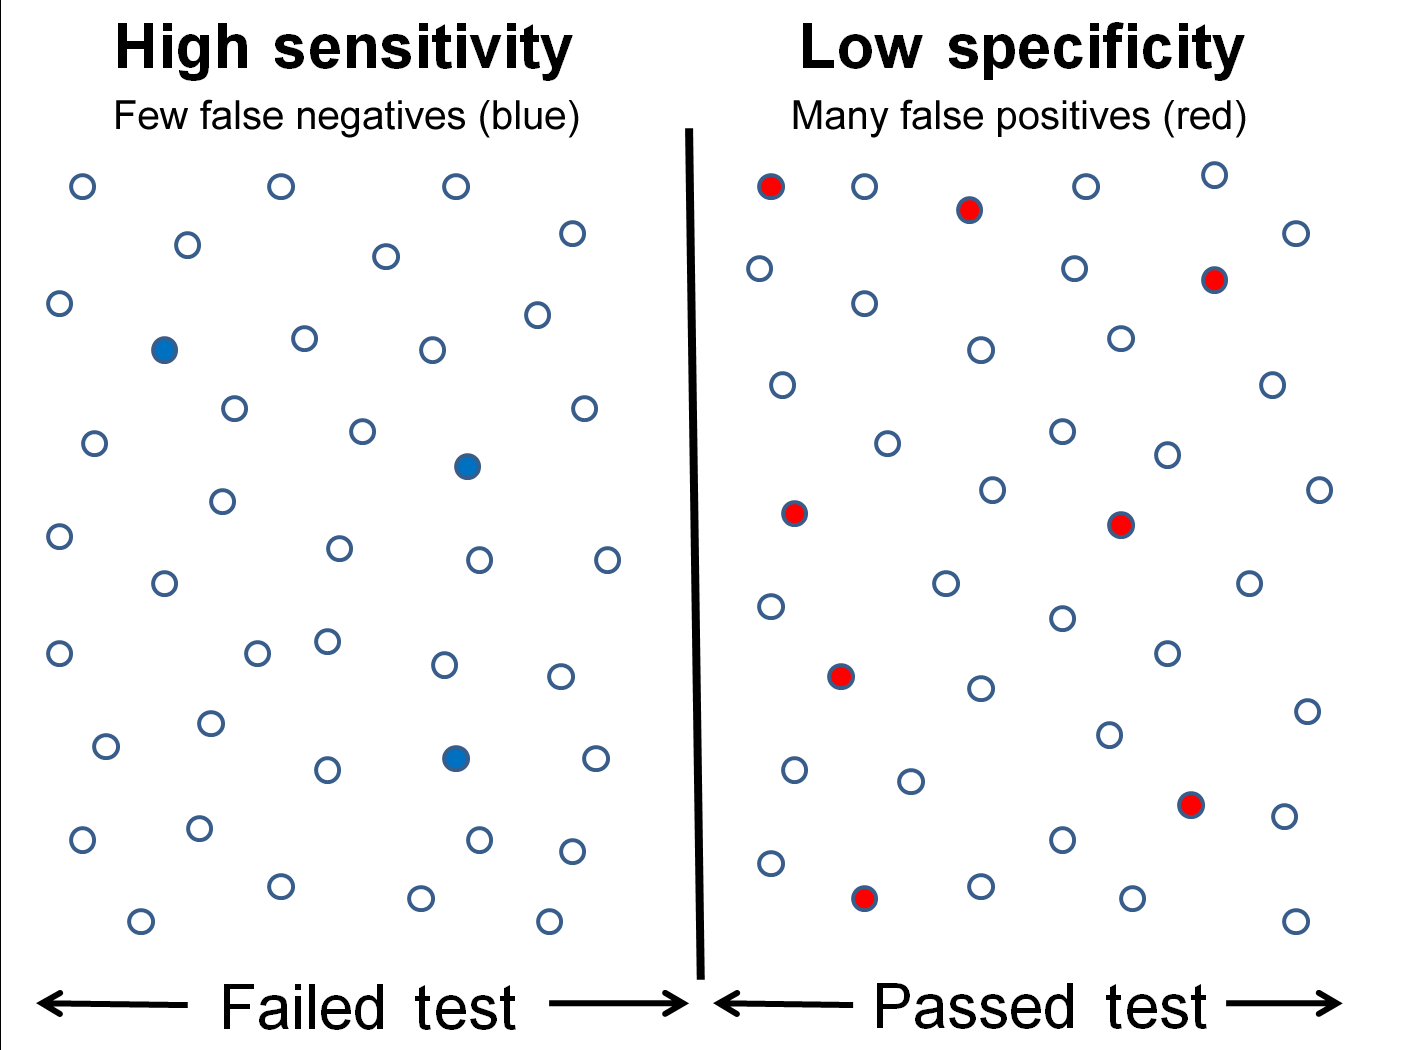
English: Graphical illustration of high sensitivity and low specificity. Each data point is represented by a circle. Data which failed the test are drawn on the left side of the vertical bar and data which passed the test are drawn on the right side of the vertical bar. False negatives are shown as closed blue circles in the left panel and false positives are shown as closed red circles in the right panel. All other data points (open circles) are either true negatives (on the left) or true positives (on the right). |
| التاريخ | |
| المصدر | عمل شخصي |
| المؤلف | Rmostell |
| إصدارات أخرى |
[]
|


ترخيص
أنا، صاحب حقوق التأليف والنشر لهذا العمل، أنشر هذا العمل تحت الرخصة التالية:
| هذا الملف متوفر تحت ترخيص المشاع الإبداعي CC0 1.0 الحقوق العامة. | |
| لقد وَضَعَ صاحب حقوق التَّأليف والنَّشر هذا العملَ في النَّطاق العامّ من خلال تنازُلِه عن حقوق العمل كُلِّها في أنحاء العالم جميعها تحت قانون حقوق التَّأليف والنَّشر، ويشمل ذلك الحقوق المُتَّصِلة بها والمُجاورة لها برمتها بما يتوافق مع ما يُحدده القانون. يمكنك نسخ وتعديل وتوزيع وإعادة إِنتاج العمل، بما في ذلك لأغراضٍ تجاريَّةٍ، دون حاجةٍ لطلب مُوافَقة صاحب حقوق العمل.
|
تاريخ الملف
اضغط على زمن/تاريخ لرؤية الملف كما بدا في هذا الزمن.
| زمن/تاريخ | صورة مصغرة | الأبعاد | مستخدم | تعليق | |
|---|---|---|---|---|---|
| حالي | ٠٠:٥٤، ١٥ مايو ٢٠٢٠ | | ١٬٤٠١ × ١٬٠٥٠ (٩٣ كيلوبايت) | wikimediacommons>Nyq | decapitalized common nouns |
استخدام الملف
الصفحة التالية تستخدم هذا الملف: