ملف:Simpson's paradox continuous.svg
اذهب إلى التنقل
اذهب إلى البحث

حجم معاينة PNG لذلك الملف ذي الامتداد SVG: ٣٩٠ × ٢٦٠ بكسل. الأبعاد الأخرى: ٣٢٠ × ٢١٣ بكسل | ٦٤٠ × ٤٢٧ بكسل | ١٬٠٢٤ × ٦٨٣ بكسل | ١٬٢٨٠ × ٨٥٣ بكسل | ٢٬٥٦٠ × ١٬٧٠٧ بكسل.
الملف الأصلي (ملف SVG، أبعاده ٣٩٠ × ٢٦٠ بكسل، حجم الملف: ١٨ كيلوبايت)
ملخص
| الوصف |
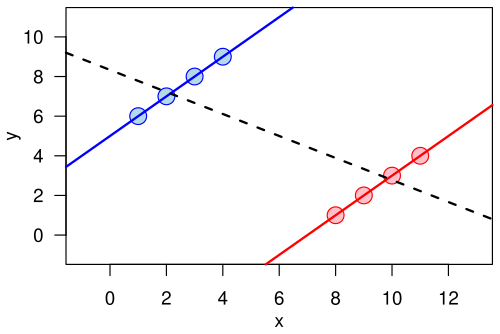
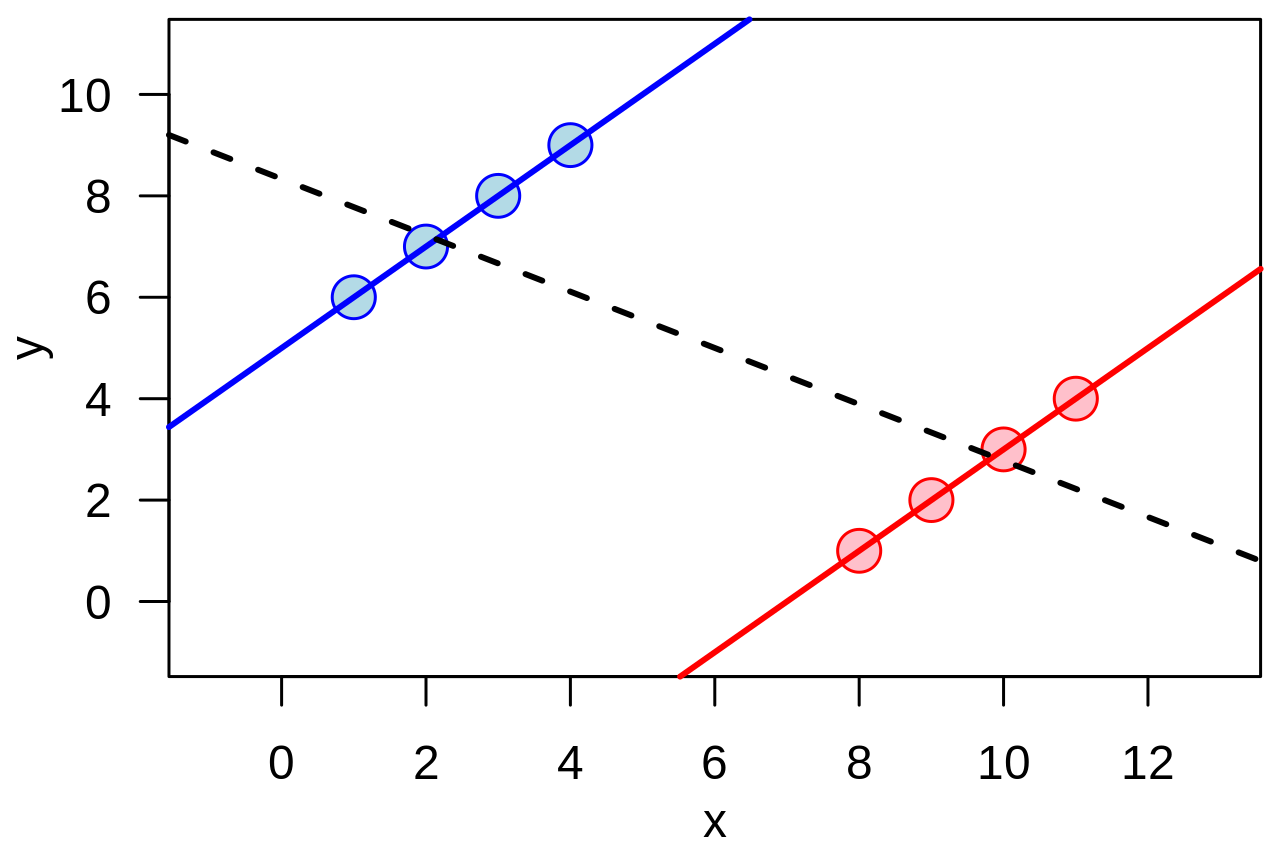
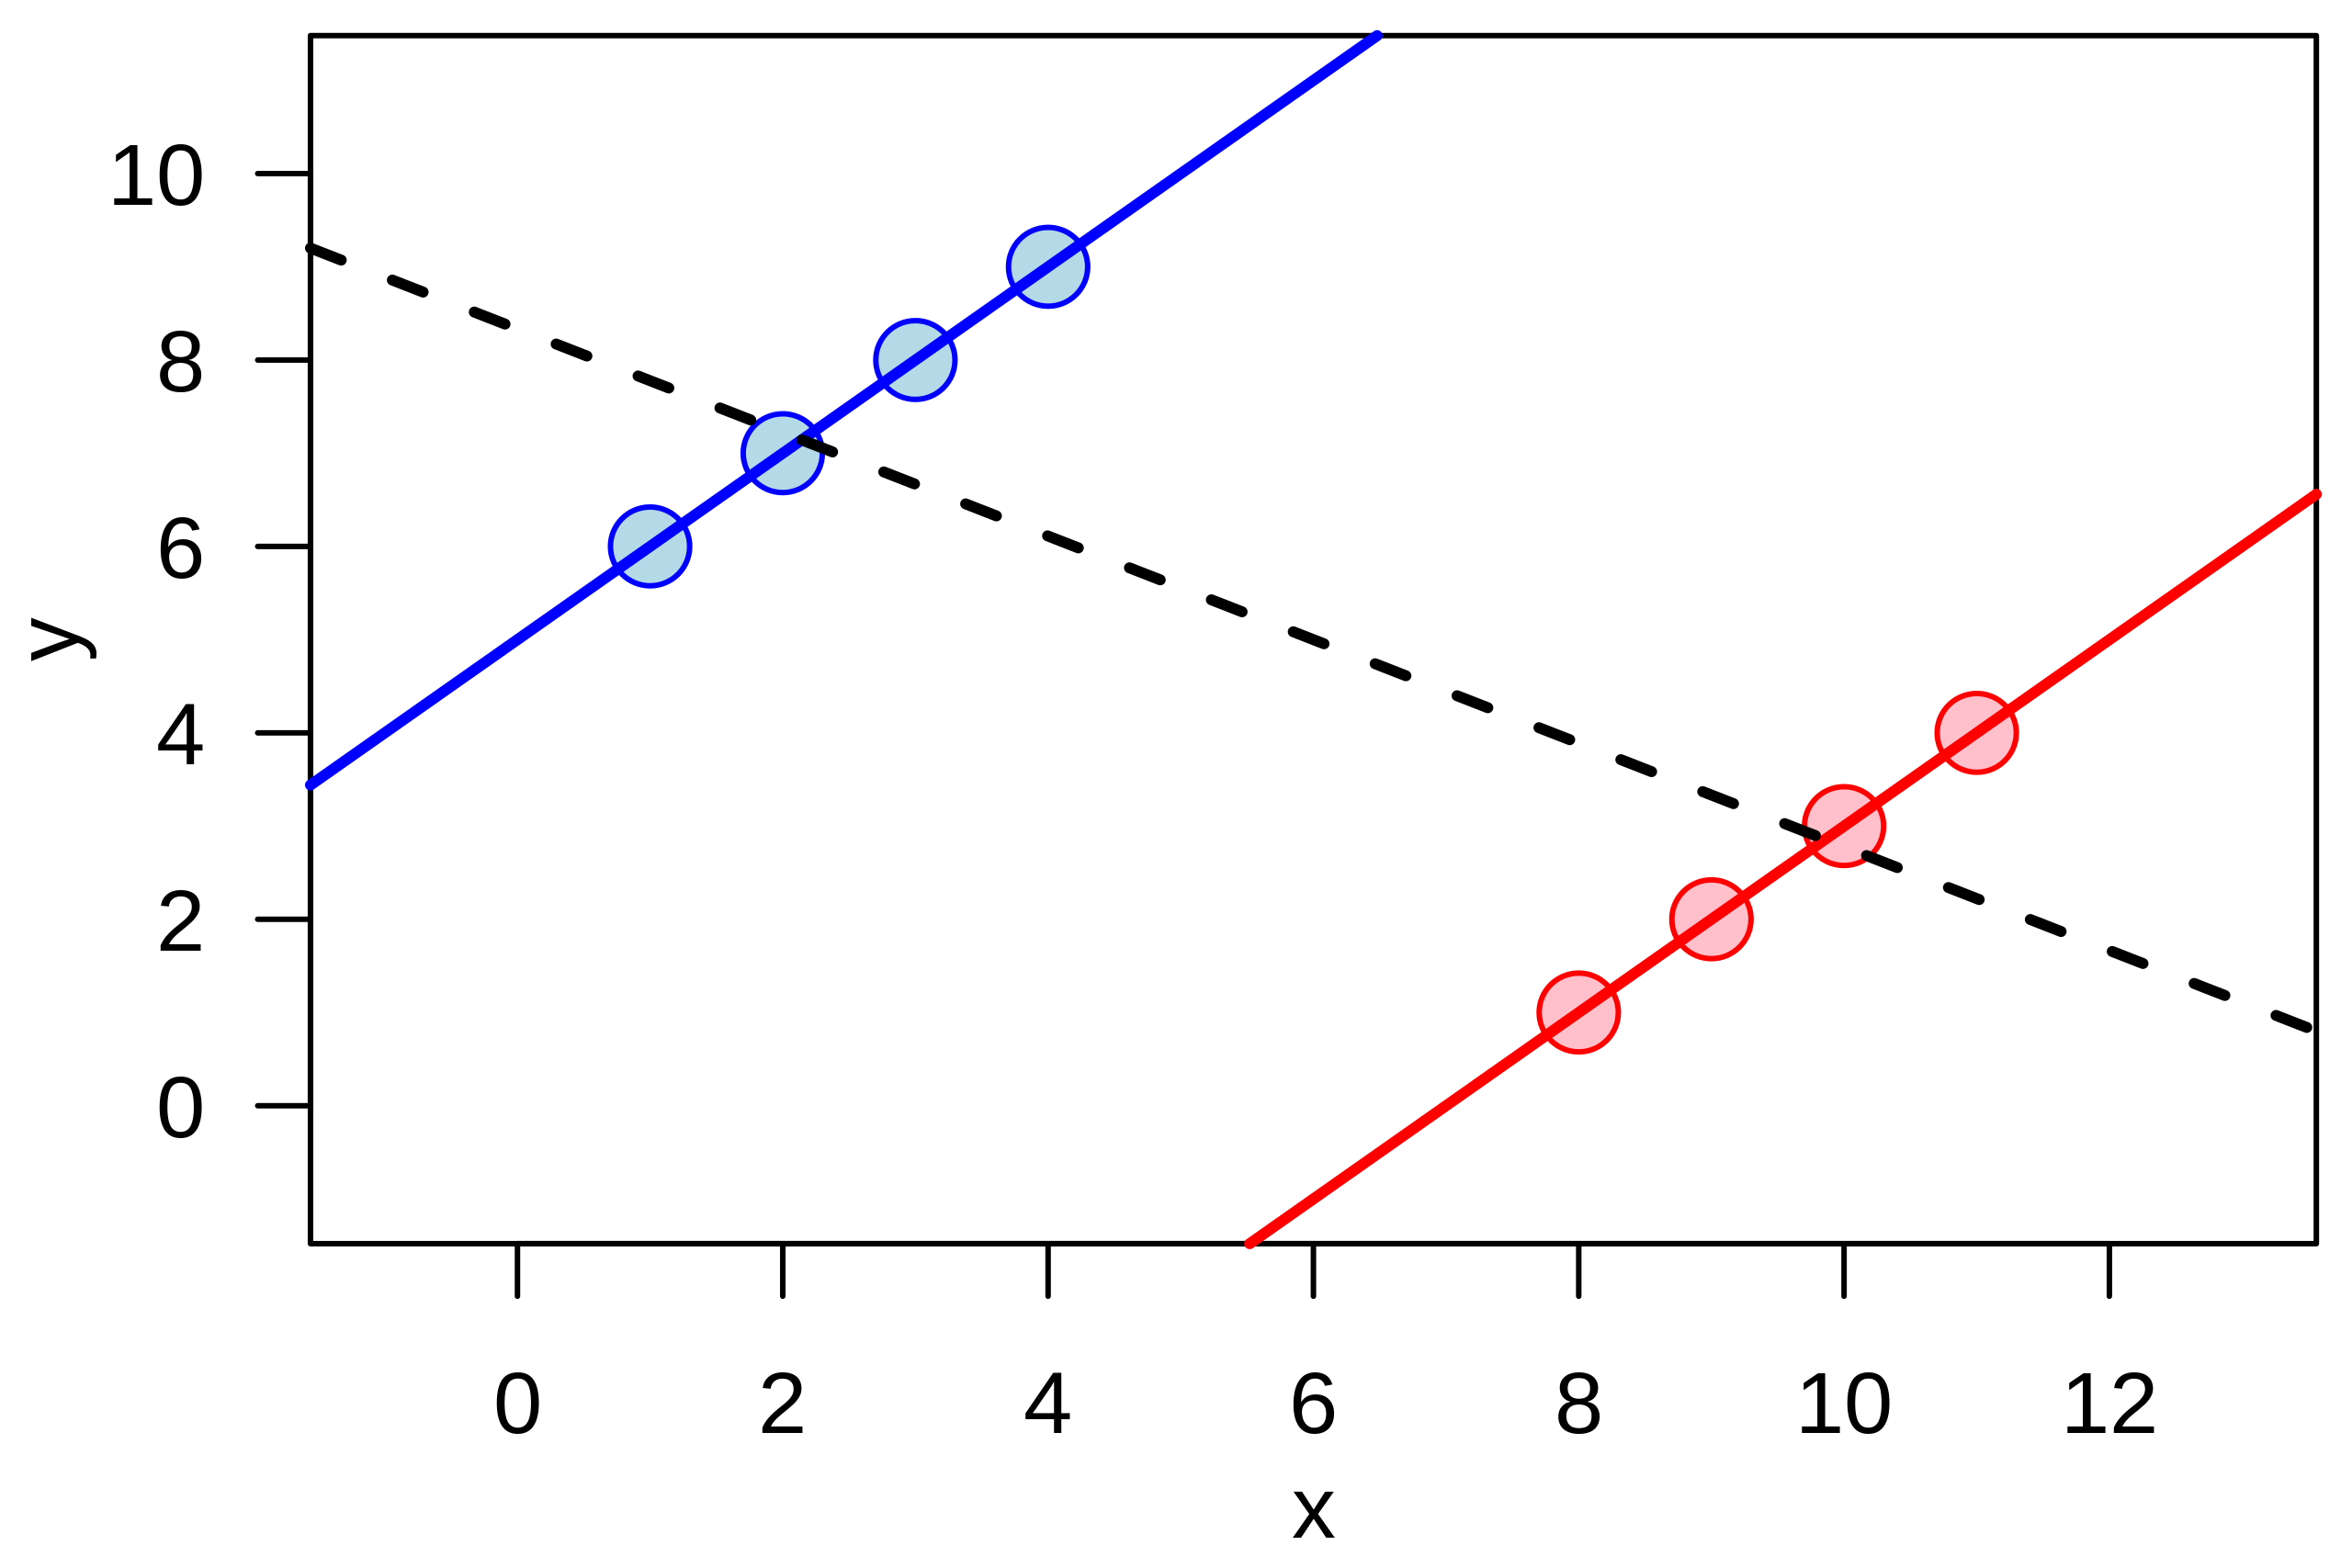
English: Illustration of the quantitative version of en:Simpson's paradox: a positive trend appears for two separate groups (blue and red), whereas a negative trend (black, dashed) appears when the groups are combined. |
| التاريخ | |
| المصدر | عمل شخصي |
| المؤلف | Schutz |
Example of the quantitative version of w:Simpson's paradox.
The graphic was created by User:Schutz for Wikipedia on 14 June 2007, using the R statistical project. The program that generated and exported the graphic is given below; the uploaded version was generated slightly differently to workaround a bug during the PS to SVG conversion with pstoedit command. The layout was slightly modified using Inkscape before upload.
  x1 <- c(1,2,3,4)
  y1 <- x1 + 5

  x2 <- x1 + 7
  y2 <- x2 - 7

  x <- c(x1,x2)
  y <- c(y1,y2)

  postscript("simpson.eps", paper="special", width=4.5, height=3)

  par(las=1)
  par(mar=c(3,3,0.5,0.5))
  par(mgp=c(2,1,0))

  plot(x,y, cex=2, pch=21,
       col=rep(c("blue", "red"), each=4), bg=rep(c("lightblue", "pink"), each=4),
       xlim=range(x)+c(-2,2), ylim=range(y)+c(-2,2))
  abline(lm(y1 ~ x1), col="blue", lwd=2)
  abline(lm(y2 ~ x2), col="red", lwd=2)
  abline(lm(y  ~ x), lwd=2, lty=2)

  dev.off()
ترخيص
| وضع -Schutz-، وهو المؤلف، هذا العمل في النِّطاق العامِّ. يسري ذلك في كل أرجاء العالم. في بعض البلدان، قد يكون هذا التَّرخيص غيرَ مُمكنٍ قانونيَّاً، في هذه الحالة: يمنح Schutz الجميع حق استخدام هذا العمل لأي غرض دون أي شرط ما لم يفرض القانون شروطًا إضافية. |
تاريخ الملف
اضغط على زمن/تاريخ لرؤية الملف كما بدا في هذا الزمن.
| زمن/تاريخ | صورة مصغرة | الأبعاد | مستخدم | تعليق | |
|---|---|---|---|---|---|
| حالي | ٠٠:١٥، ١٤ يونيو ٢٠٠٧ | | ٣٩٠ × ٢٦٠ (١٨ كيلوبايت) | wikimediacommons>Schutz | {{Information |Description=Illustration of the continuous version of Simpson's paradox |Source=self-made |Date=14 June 2007 |Author=Schutz }} Example of the continuous version of w:Simpson's paradox. The graphic was created by [[User |
استخدام الملف
الصفحة التالية تستخدم هذا الملف: